


Java 最优雅的 PDF 生成方式:HTML 模板化全攻略
💡 为什么选择 HTML 模板生成 PDF?
在 Java 中生成 PDF,传统方式(如 iText)虽然功能强大,但代码冗长、样式写死、调试困难,开发体验一言难尽。而 HTML 模板方式,则以极致的优雅和灵活性,彻底改变了 PDF 生成的方式:
✅ 样式高度可控,好看到不像 PDF
使用 HTML + CSS 来定义 PDF 样式,意味着你可以像写网页一样去设计 PDF 页面。支持字体、颜色、边框、布局、响应式等几乎所有你熟悉的前端技术,所见即所得,页面美感大幅提升。再也不用手写笨重的 layout API。
✅ 模板化开发,维护效率提升数倍
借助 Thymeleaf、Freemarker 等模板引擎,PDF 的结构和数据完全分离。一个模板支持多种数据组合,不仅便于开发复用,也让迭代改版几乎不需要动 Java 代码。你甚至可以交给设计同事去改页面结构。
✅ 支持实时预览,所见即所得
你可以直接在浏览器中预览 HTML 模板的效果,不用每次都生成 PDF 才看结果。调试更快,开发体验极致丝滑。
✅ 易于对接 Web 页面,统一视觉风格
许多系统中需要生成的 PDF 报表、合同、凭证、工单,其实和 Web 页面差不多。用 HTML 生成 PDF,可以轻松做到页面与导出的 PDF 完全一致,实现 视觉风格统一,品牌感提升。
话不多说我们看实际效果

一、需要先安装NodeJs
具体安装链接:https://blog.csdn.net/Nicolecocol/article/details/136788200
二、安装puppeteer依赖,如果npm下载不成功就使用pnpm命令(pnpm需要先安装)
npm install -g pnpm
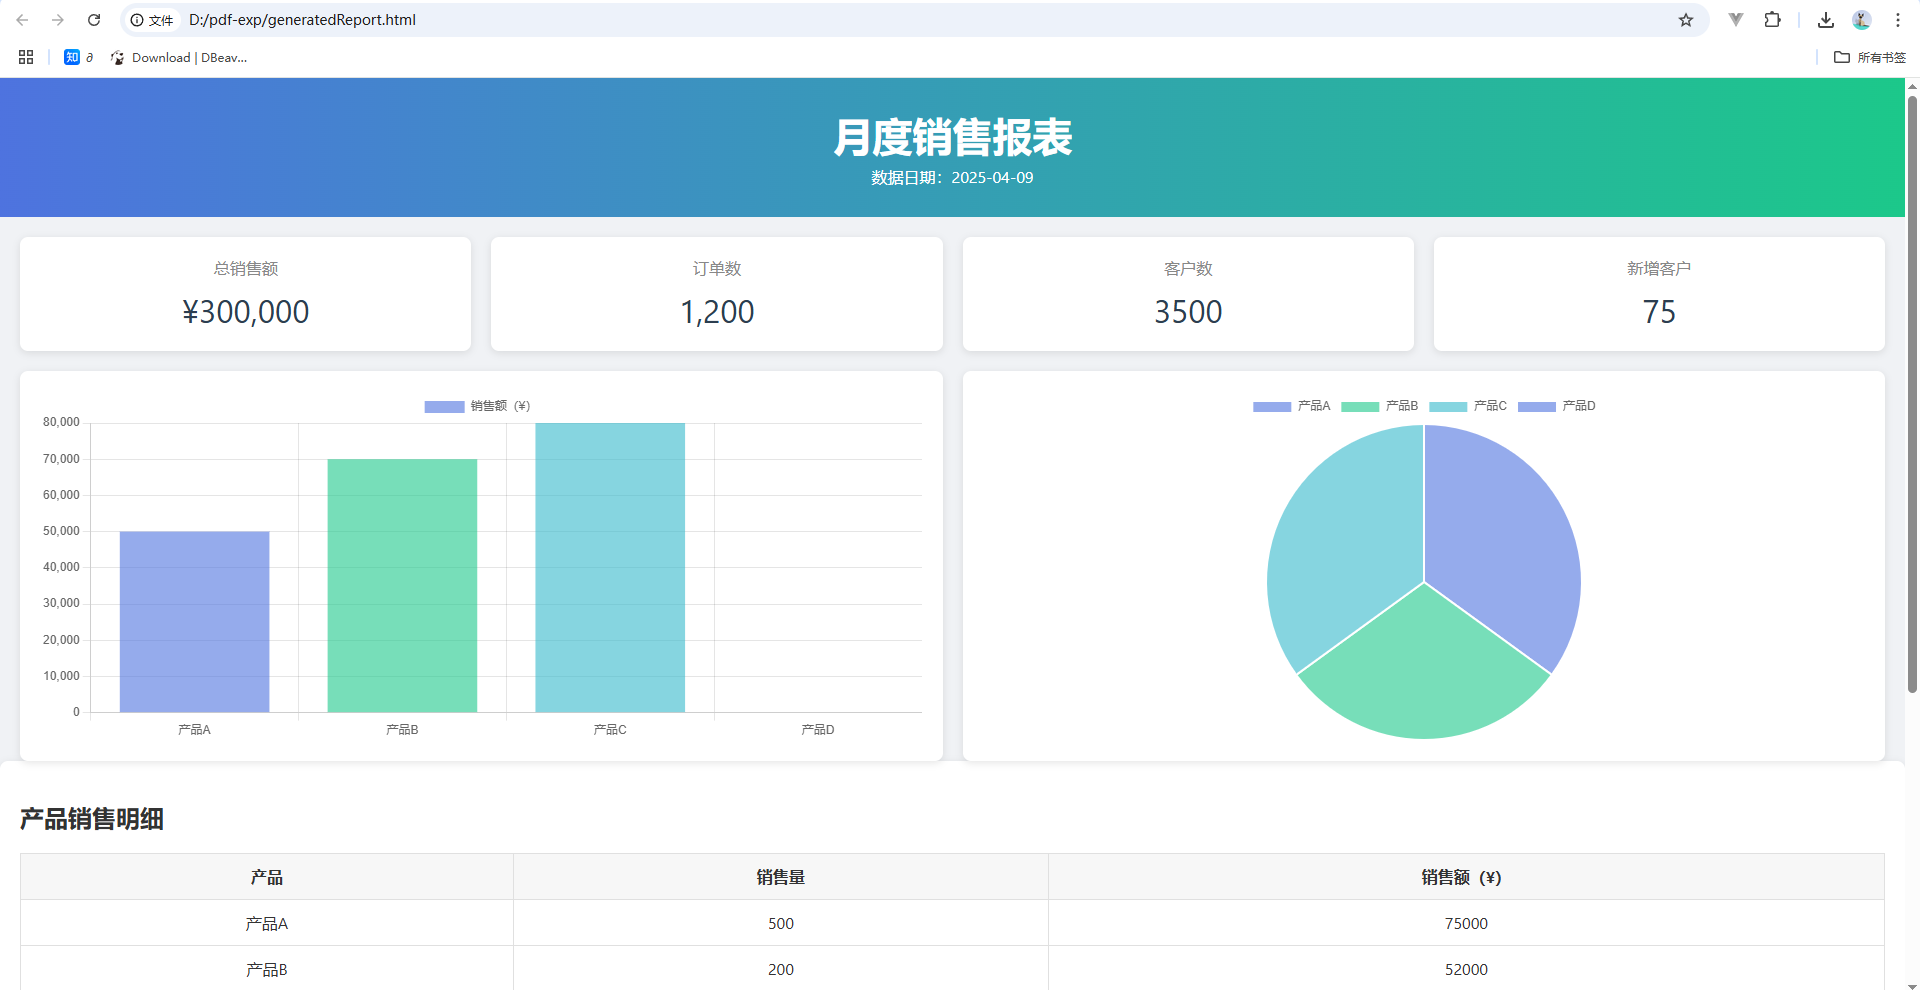
这里我下载了一个报表模板的HTML文件这里是写死的静态文件
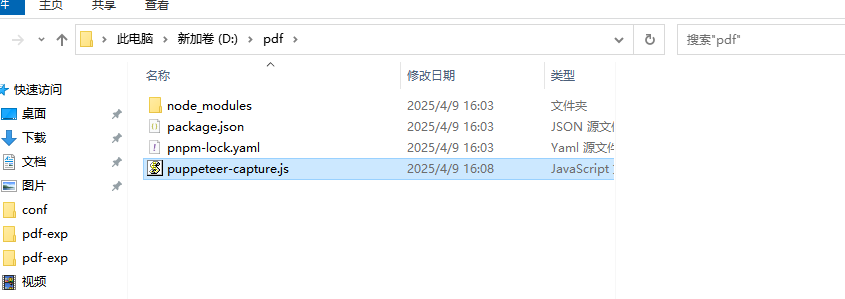
我们先创建一个文件夹名字自行取名
进入到当前文件夹cmd命令安装puppeteer依赖执行
pnpm install puppeteer
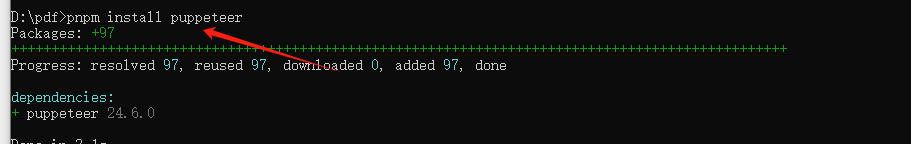
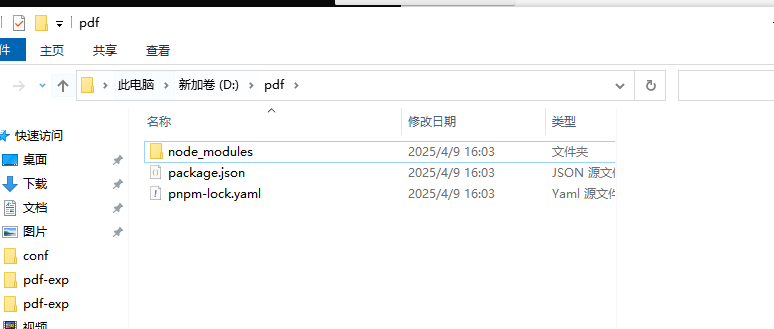
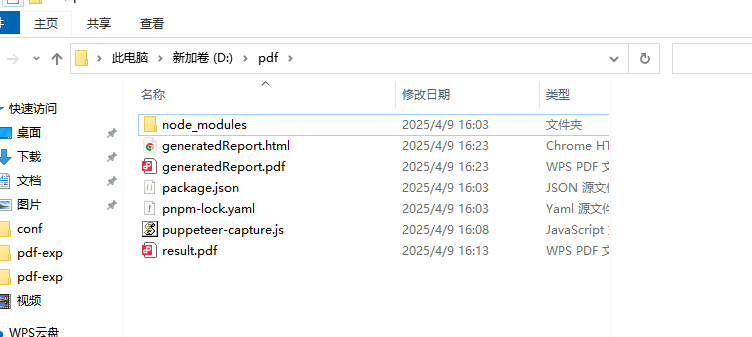
执行完以后可以看到文件夹加了依赖
三、在安装puppeteer依赖的目录下创建puppeteer.js
// puppeteer-capture.js
const puppeteer = require('puppeteer');
const fs = require('fs');
const path = require('path');

(async () => {
  const inputPath = process.argv[2];
  const outputPath = process.argv[3];

  const browser = await puppeteer.launch({
    headless: 'new',
    args: ['--no-sandbox', '--disable-setuid-sandbox']
  });

  const page = await browser.newPage();

  // ✅ 加 file:// 协议,并确保路径是绝对路径
  const fullPath = `file://${path.resolve(inputPath)}`;
  await page.goto(fullPath, { waitUntil: 'networkidle0' });


  // 生成 PDF
await page.pdf({
  path: outputPath,
  width: '1000px',//pdf宽度
  height: '1500px',  //pdf高度
  printBackground: true,
  margin: { top: '20px', bottom: '20px', left: '20px', right: '20px' }
});


  await browser.close();
})();

我们执行html转pdf命令测试一下效果 :
前端静态文件下载地址:https://znunwm.top/upload/2025/04/generatedReport.html
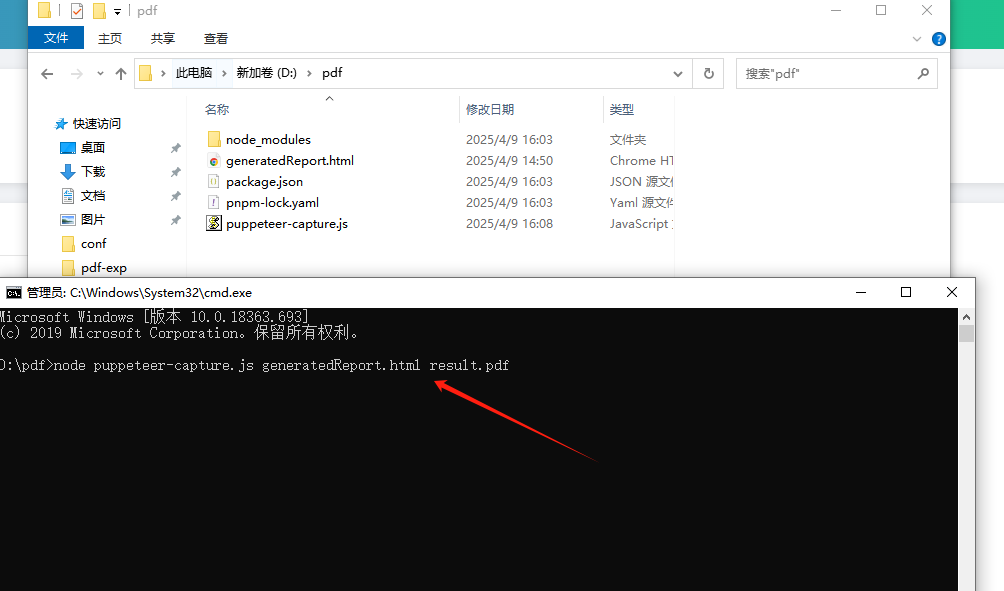
执行 node puppeteer-capture.js generatedReport.html result.pdf
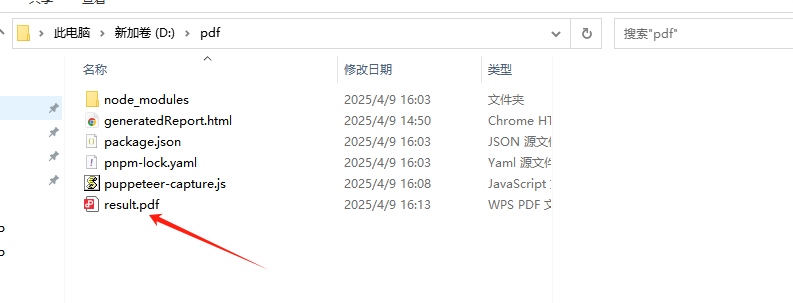
这里环境测试pdf文件正常生成以后就可以了。
四、Java项目中使用
1.加入maven依赖:
SpringBoot项目基础web依赖什么的我就不加了, 这里用到了模板引擎我们加入模板引擎依赖
        <dependency>
            <groupId>org.springframework.boot</groupId>
            <artifactId>spring-boot-starter-thymeleaf</artifactId>
        </dependency>
在resources新建templates文件夹把salesReport.html模板文件放进去

代码明细:
<!DOCTYPE html>
<html lang="zh-CN" xmlns:th="http://www.thymeleaf.org">
<head>
    <meta charset="UTF-8">
    <meta name="viewport" content="width=device-width, initial-scale=1.0">
    <title>月度销售报表</title>
    <style>
        body {
            font-family: 'Segoe UI', Tahoma, Geneva, Verdana, sans-serif;
            margin: 0;
            background-color: #f0f2f5;
            color: #333;
        }
        .header {
            background: linear-gradient(90deg, #4e73df, #1cc88a);
            color: #fff;
            padding: 30px 20px;
            text-align: center;
        }
        .header h1 { margin: 0; font-size: 2.5em; }
        .header p { margin: 5px 0 0; font-size: 1em; }
        .summary-cards {
            display: grid;
            grid-template-columns: repeat(auto-fit, minmax(200px, 1fr));
            gap: 20px;
            padding: 20px;
        }
        .card {
            background-color: #fff;
            border-radius: 8px;
            box-shadow: 0 2px 8px rgba(0,0,0,0.1);
            padding: 20px;
            text-align: center;
        }
        .card .label { font-size: 1em; color: #888; }
        .card .value { font-size: 2em; margin-top: 10px; color: #2c3e50; }
        .container {
            display: grid;
            grid-template-columns: 1fr 1fr;
            gap: 20px;
            padding: 0 20px;
        }
        .chart-container, .table-container {
            background-color: #fff;
            border-radius: 8px;
            box-shadow: 0 2px 8px rgba(0,0,0,0.1);
            padding: 20px;
        }
        .chart-container { height: 350px; }
        .table-container { overflow-x: auto; }
        .additional-sections {
            display: grid;
            grid-template-columns: repeat(auto-fit, minmax(300px, 1fr));
            gap: 20px;
            padding: 20px;
        }
        .block {
            background-color: #fff;
            border-radius: 8px;
            box-shadow: 0 2px 8px rgba(0,0,0,0.1);
            padding: 20px;
            display: flex;
            flex-direction: column;
            height: 300px;
        }
        .block h3 { margin: 0 0 10px; font-size: 1.2em; color: #4e73df; }
        .block canvas { flex: 1; }
        table {
            width: 100%;
            border-collapse: collapse;
            margin-top: 10px;
        }
        table th, table td {
            padding: 12px;
            border: 1px solid #e0e0e0;
            text-align: center;
        }
        table th { background-color: #f7f7f7; }
    </style>
</head>
<body>
<div class="header">
    <h1>月度销售报表</h1>
    <p th:text="'数据日期:' + ${reportDate}"></p>
</div>

<div class="summary-cards">
    <div class="card" th:each="item : ${summaryList}">
        <div class="label" th:text="${item.label}"></div>
        <div class="value" th:text="${item.value}"></div>
    </div>
</div>

<div class="container">
    <div class="chart-container"><canvas id="salesChart"></canvas></div>
    <div class="chart-container"><canvas id="productPieChart"></canvas></div>
</div>

<div class="table-container">
    <h2>产品销售明细</h2>
    <table>
        <thead><tr><th>产品</th><th>销售量</th><th>销售额(¥)</th></tr></thead>
        <tbody>
        <tr th:each="product : ${productList}">
            <td th:text="${product.name}"></td>
            <td th:text="${product.count}"></td>
            <td th:text="${product.amount}"></td>
        </tr>
        </tbody>
    </table>
</div>

<div class="additional-sections">
    <div class="block"><h3>地区销售分布</h3><canvas id="regionChart"></canvas></div>
    <div class="block"><h3>渠道销售占比</h3><canvas id="channelChart"></canvas></div>
    <div class="block"><h3>客户细分</h3><canvas id="customerChart"></canvas></div>
    <div class="block"><h3>环比增长</h3><canvas id="momChart"></canvas></div>
    <div class="block"><h3>同比增长</h3><canvas id="yoyChart"></canvas></div>
</div>

<script src="https://cdn.jsdelivr.net/npm/chart.js"></script>
<script th:inline="javascript">
    const colors = ['rgba(78,115,223,0.6)', 'rgba(28,200,138,0.6)', 'rgba(54,185,204,0.6)', 'rgba(246,194,62,0.6)', 'rgba(231,74,59,0.6)'];

    const salesData = [[${salesChart.data}]];
    const productData = [[${productPieChart.data}]];
    const regionData = [[${regionChart.data}]];
    const channelData = [[${channelChart.data}]];
    const customerData = [[${customerChart.data}]];
    const momData = [[${momChart.data}]];
    const yoyData = [[${yoyChart.data}]];
    const revenueData = [[${revenueChart.data}]];
    new Chart(document.getElementById('salesChart').getContext('2d'), {
        type: 'bar', data: { labels: ['产品A','产品B','产品C','产品D'], datasets:[{ label:'销售额(¥)', data:salesData, backgroundColor: colors }] }, options:{ scales:{ y:{ beginAtZero:true } }, responsive:true, maintainAspectRatio:false }
    });

    // 饼图 - 产品占比
    new Chart(document.getElementById('productPieChart').getContext('2d'), {
        type: 'pie', data:{ labels:['产品A','产品B','产品C','产品D'], datasets:[{ data:productData, backgroundColor: colors }] }, options:{ responsive:true, maintainAspectRatio:false }
    });

    // 地区销售分布 - 环形图
    new Chart(document.getElementById('regionChart').getContext('2d'), {
        type: 'doughnut', data:{ labels:['北区','南区','东区','西区'], datasets:[{ data:regionData, backgroundColor: colors }] }, options:{ responsive:true, maintainAspectRatio:false }
    });

    // 渠道销售占比 - 圆环图
    new Chart(document.getElementById('channelChart').getContext('2d'), {
        type: 'doughnut', data:{ labels:['线上','线下','分销'], datasets:[{ data:channelData, backgroundColor: colors }] }, options:{ responsive:true, maintainAspectRatio:false }
    });

    // 客户细分 - 条形图
    new Chart(document.getElementById('customerChart').getContext('2d'), {
        type: 'bar', data:{ labels:['VIP','老客','新客'], datasets:[{ label:'客户数', data:customerData, backgroundColor: colors }] }, options:{ scales:{ y:{ beginAtZero:true } }, responsive:true, maintainAspectRatio:false }
    });

    // 环比增长 - 折线图
    new Chart(document.getElementById('momChart').getContext('2d'), {
        type: 'line', data:{ labels:['1月','2月','3月','4月'], datasets:[{ label:'环比增长%', data:momData, backgroundColor:colors[0], fill:false, tension:0.4 }] }, options:{ responsive:true, maintainAspectRatio:false }
    });

    // 同比增长 - 折线图
    new Chart(document.getElementById('yoyChart').getContext('2d'), {
        type: 'line', data:{ labels:['2023','2024','2025'], datasets:[{ label:'同比增长%', data:yoyData, backgroundColor:colors[1], fill:false, tension:0.4 }] }, options:{ responsive:true, maintainAspectRatio:false }
    });

    // 回款情况 - 条形图
    new Chart(document.getElementById('revenueChart').getContext('2d'), {
        type: 'bar', data:{ labels:['1月','2月','3月'], datasets:[{ label:'回款(¥)', data:revenueData, backgroundColor:colors }] }, options:{ scales:{ y:{ beginAtZero:true } }, responsive:true, maintainAspectRatio:false }
    });
</script>
</body>
</html>
2.具体JAVA代码
新增接口controller
package com.czh.controller;

import com.czh.aop.annotation.Anonymous;
import com.czh.service.ReportService;
import lombok.AllArgsConstructor;
import org.springframework.web.bind.annotation.GetMapping;
import org.springframework.web.bind.annotation.RestController;
import javax.servlet.http.HttpServletResponse;


/**
 * @author czh
 * @version 1.0
 * @description:
 * @date 2025/4/9 14:01
 */


@RestController
@AllArgsConstructor
public class ReportController {

    private final ReportService reportService;

    @GetMapping("/report")
    public void getMonthlyReport(HttpServletResponse response) {
        reportService.generateMonthlyReport(response);
    }
}
ReportService
package com.czh.service;

import javax.servlet.http.HttpServletResponse;

public interface ReportService {

    void generateMonthlyReport(HttpServletResponse response);
}
实现类ReportServiceImpl
package com.czh.service.impl;

import com.czh.domain.model.ChartData;
import com.czh.domain.model.Product;
import com.czh.domain.model.SummaryItem;
import com.czh.service.ReportService;
import lombok.AllArgsConstructor;
import org.springframework.stereotype.Service;
import org.thymeleaf.TemplateEngine;
import org.thymeleaf.context.Context;

import javax.servlet.ServletOutputStream;
import javax.servlet.http.HttpServletResponse;
import java.io.File;
import java.io.FileInputStream;
import java.io.FileWriter;
import java.io.IOException;
import java.time.LocalDate;
import java.util.Arrays;

/**
 * @author czh
 * @version 1.0
 * @description:
 * @date 2025/4/9 15:22
 */
@Service
@AllArgsConstructor
public class ReportServiceImpl implements ReportService {

    private final TemplateEngine templateEngine;

    @Override
    public void generateMonthlyReport(HttpServletResponse response) {

        //执行HTML模板填充
        Context model = buildReportContext();

        // 生成 HTML 文件
        String html = templateEngine.process("salesReport", model);
        //生成html文件存储位置
        File htmlFile = new File("D:/pdf/generatedReport.html");

        //生成pdf文件存储位置
        File pdfFile = new File("D:/pdf/generatedReport.pdf");

        try (FileWriter writer = new FileWriter(htmlFile)) {
            writer.write(html);
        } catch (IOException e) {
            throw new RuntimeException("写入 HTML 文件失败", e);
        }

        // 调用 puppeteer 转换为 PDF
        try {
            ProcessBuilder processBuilder = new ProcessBuilder(
                    "node",
                    "D:/pdf/puppeteer-capture.js",
                    htmlFile.getAbsolutePath(),
                    pdfFile.getAbsolutePath()
            );
            Process process = processBuilder.start();
            process.waitFor();

            // 输出到浏览器
            try (FileInputStream fis = new FileInputStream(pdfFile);
                 ServletOutputStream out = response.getOutputStream()) {
                response.setContentType("application/pdf");
                byte[] buffer = new byte[1024];
                int length;
                while ((length = fis.read(buffer)) != -1) {
                    out.write(buffer, 0, length);
                }
                out.flush();
            }
        } catch (IOException | InterruptedException e) {
            throw new RuntimeException("生成 PDF 失败", e);
        }
    }

       //模板数据填充方法
    private Context buildReportContext() {
        Context model = new Context();
        model.setVariable("reportDate", LocalDate.now());

        model.setVariable("summaryList", Arrays.asList(
                new SummaryItem("总销售额", "¥300,000"),
                new SummaryItem("订单数", "1,200"),
                new SummaryItem("客户数", "3500"),
                new SummaryItem("新增客户", "75")
        ));

        model.setVariable("productList", Arrays.asList(
                new Product("产品A", 500, 75000),
                new Product("产品B", 200, 52000),
                new Product("产品C", 400, 73000)
        ));

        model.setVariable("salesChart", new ChartData("bar", "月销售趋势", new String[]{"1月", "2月", "3月"}, new int[]{50000, 70000, 80000}));
        model.setVariable("productPieChart", new ChartData("pie", "产品销售占比", new String[]{"产品A", "产品B", "产品C"}, new int[]{35, 30, 35}));
        model.setVariable("regionChart", new ChartData("bar", "地区销售", new String[]{"华北", "华东", "华南"}, new int[]{50000, 30000, 40000}));
        model.setVariable("channelChart", new ChartData("doughnut", "销售渠道", new String[]{"线上", "线下"}, new int[]{60, 40}));
        model.setVariable("customerChart", new ChartData("pie", "客户细分", new String[]{"企业", "个人", "代理商"}, new int[]{45, 40, 15}));
        model.setVariable("momChart", new ChartData("line", "环比增长", new String[]{"1月", "2月", "3月"}, new int[]{10, 20, 30}));
        model.setVariable("yoyChart", new ChartData("line", "同比增长", new String[]{"2022", "2023", "2024"}, new int[]{100, 130, 160}));
        model.setVariable("revenueChart", new ChartData("bar", "回款情况", new String[]{"1月", "2月", "3月"}, new int[]{40000, 50000, 60000}));
        return model;
    }
}
访问接口:http://localhost:10002/report 这里端口是你本地端口
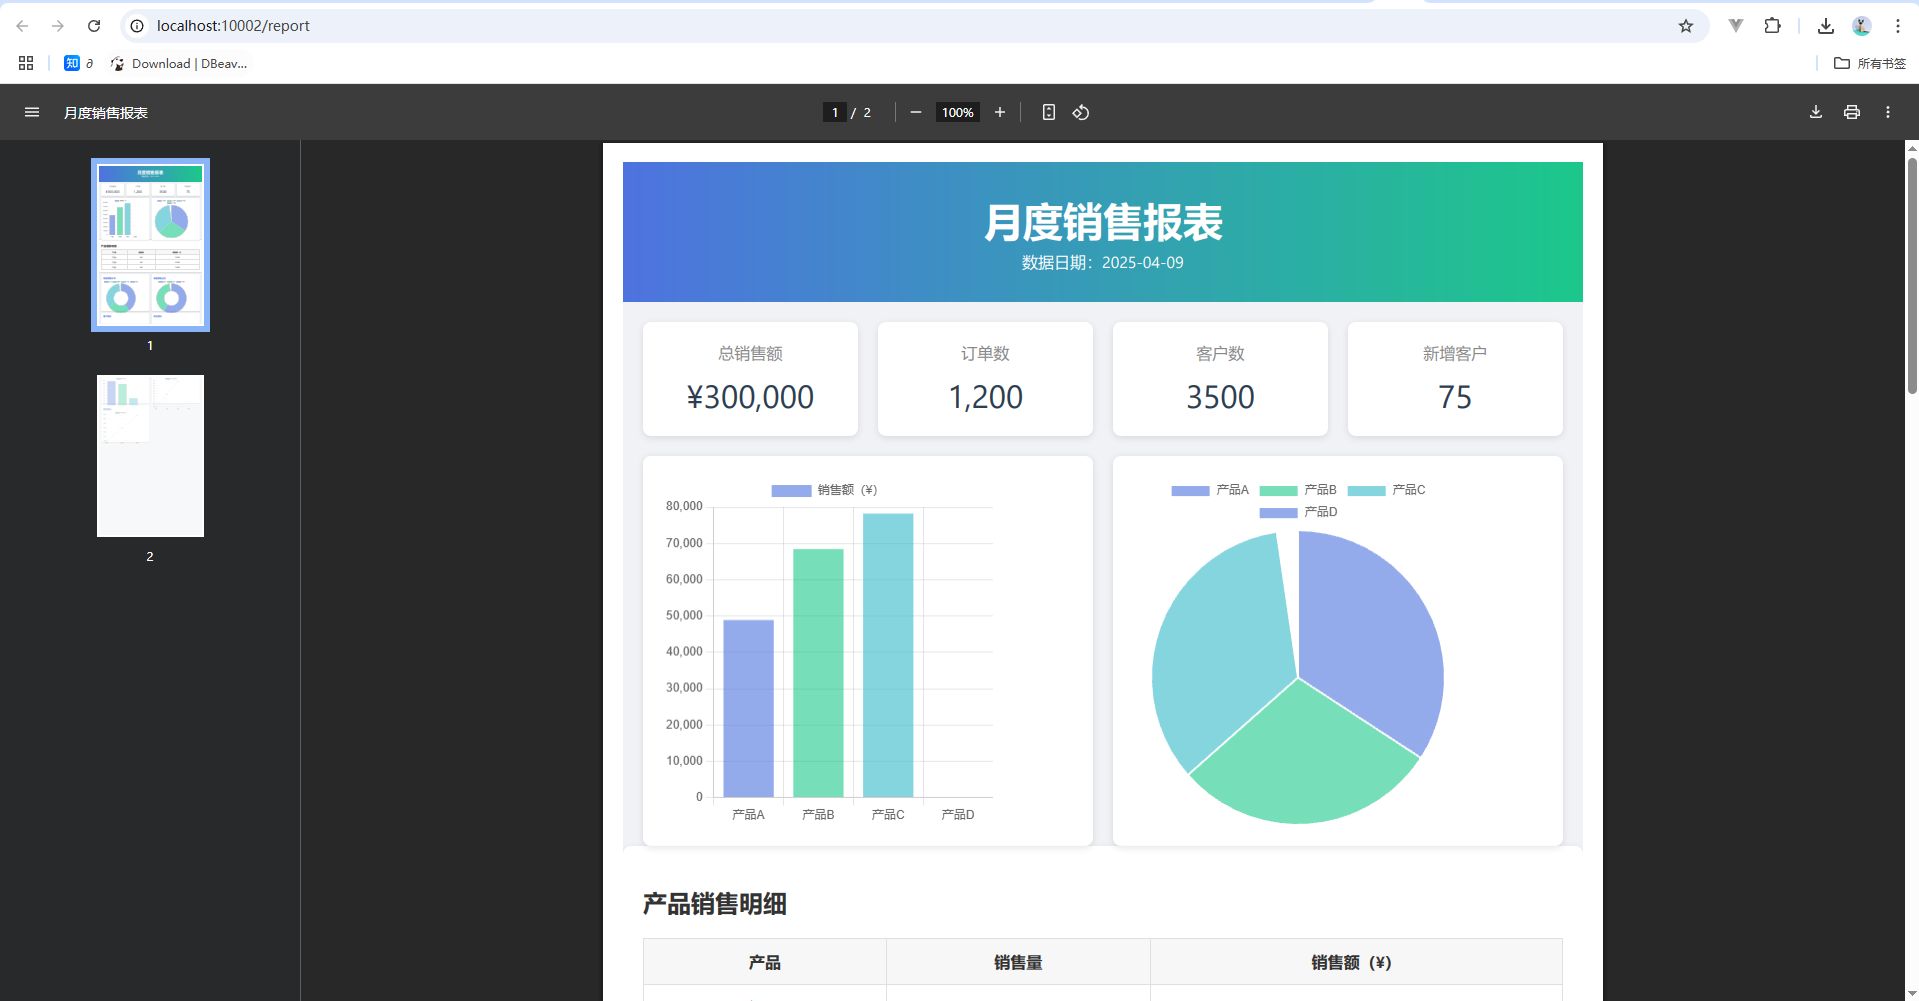
本地文件已经生成了
五、前端
新建一个html文件
<!DOCTYPE html>
<html lang="zh">
<head>
    <meta charset="UTF-8">
    <title>销售报表</title>
</head>
<body>
<h2>点击生成报表</h2>
<a href="http://localhost:10002/report" target="_blank">生成并查看报表 PDF</a>
</body>
</html>

如果是vue项目也是一样的做个接口跳转就可以了
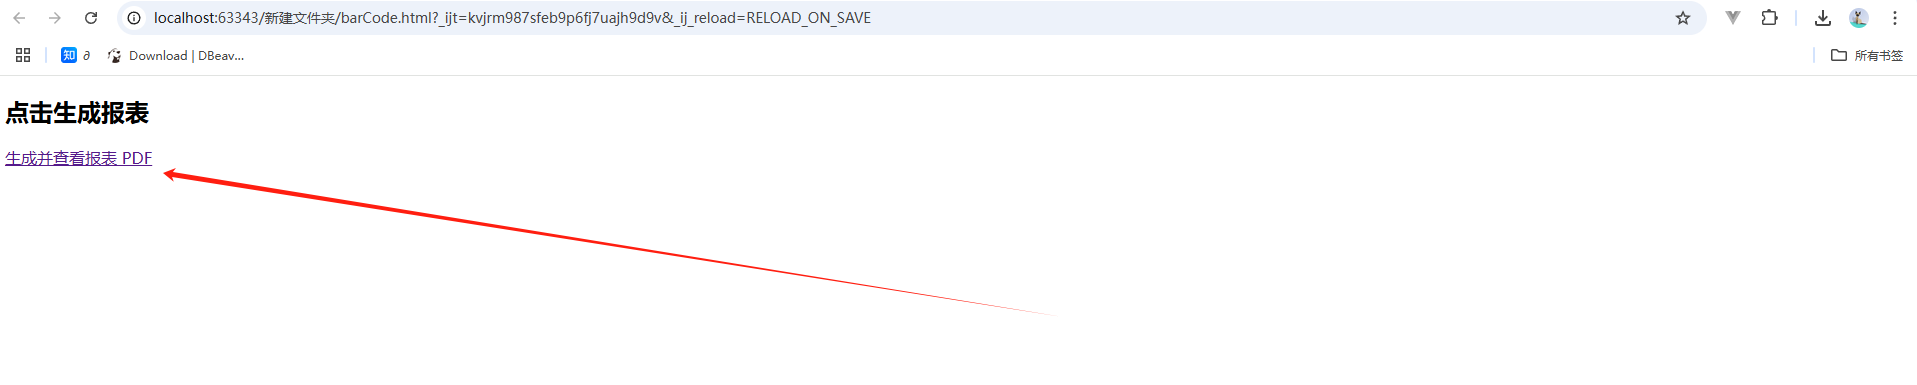
如果跳转正常显示那就是大功告成了!
👉 欢迎加入陈思源的星球,你将获得: 专属的项目实战 / 1v1 提问 / *Java 学习路线 /* 学习打卡 / 社群讨论
👉 欢迎NodeJs安装

评论区